Enterprise Syslog
GrayLog
Our Solutions
Network
Monitoring


Introduction
Graylog Operations is built on the Graylog platform for IT, Network, and DevOps professionals. Available in a self-managed or cloud experience, Graylog Operations offers a powerful, flexible, and seamless centralized log management experience. You have increased visibility into day-to-day operations to gain meaningful context from volumes of event log data, pinpoint errors, take action faster, and improve key metrics like Mean Time To Detect (MTTD) and Mean Time To Respond (MTTR).

Benefits

ARCHIVING
Store older data on slow storage and easily re-import it into Graylog when you need it

CORRELATION AND ALERTING
Receive alerts via email, text, Slack, and more. Update alert criteria based on a dynamic list in a lookup table

DYNAMIC LOOKUP TABLES
Perform faster research by adding WHOIS, IP Geolocation, threat intelligence, or other structured data

GRAYLOG USER LOGS
Track who accessed what log data and what actions they took against it to ensure compliance and security

INTEGRATIONS
Easily share data with other business-critical systems for full transparency and collaboration

SCHEDULE REPORTS
Leverage Graylog’s dashboard functionality to easily build and configure scheduled reports.

REST API
Easily integrate your data into 3rd party systems to automate reporting, workflow and research

SEARCH WORKFLOW
Build and combine multiple searches for any type of analysis into one action and export results to a dashboard

TEAMS MANAGEMENT
Control entity access and capabilities. Includes LDAP/Active Directory integration.

CORRELATION ENGINE
Get email, text, Slack, or other message type alerts on single, combined, or missing events

ILLUMINATE
Start fast with prebuilt content — search templates, dashboards, correlated alerts, reports, dynamic look-up tables, streams & pipelines, and more

LOG VIEW
View data in real-time, ensure continued availability, streamline investigations

STREAMS & PIPELINES
Route log messages into categories in real time and control data processing by tying streams to your pipelines.

SEARCH TEMPLATES
Enter one or more criteria for a more comprehensive search or dashboard view. Easily save and share parameterized searches and dashboards.
Integrations

Cluster-to-Cluster Forwarder

Operations Output Framework

Script Alert Notification

Okta Log Events Input

Microsoft Office 365 Log Events Input
GreyNoise Operations Data Adapter
ThreatFox IOC Tracker Data Adapter

URLhaus Malware URL Data
Start Smart with Pre-Built Content
Visualize Your Application Data in Pre-Built Dashboards
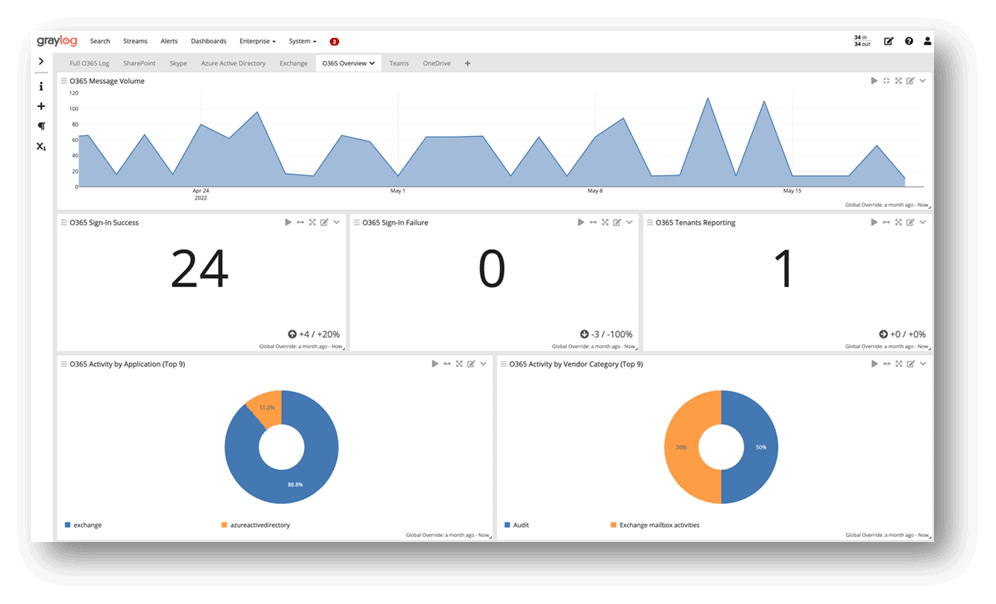
Explore Data, Trace Errors, Detect Threats
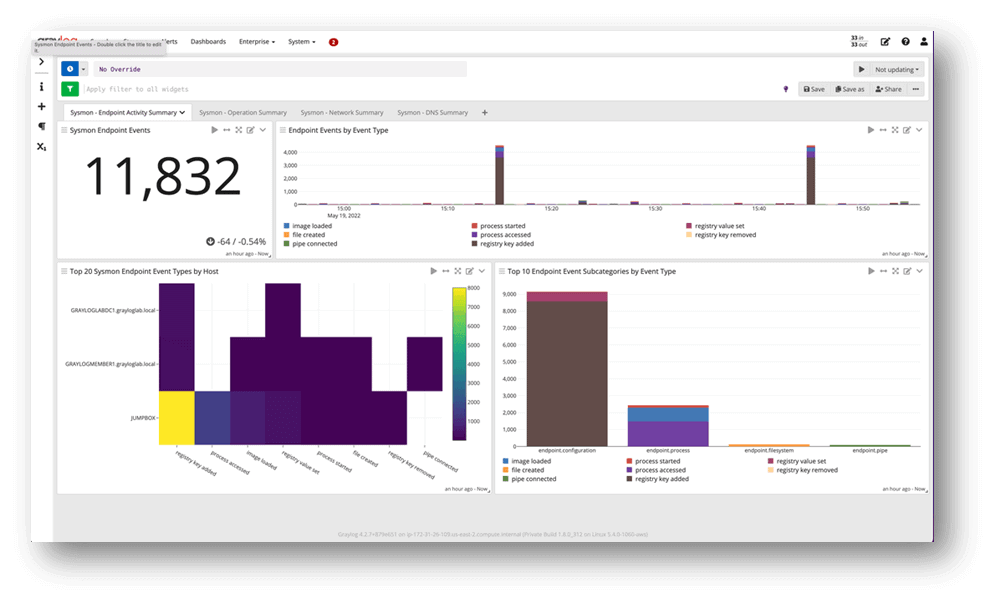
Consistency in Reporting, Alerting, and Analysis
Get valuable information from the available reports. Everything has been well though in Nagios XI’s reporting.
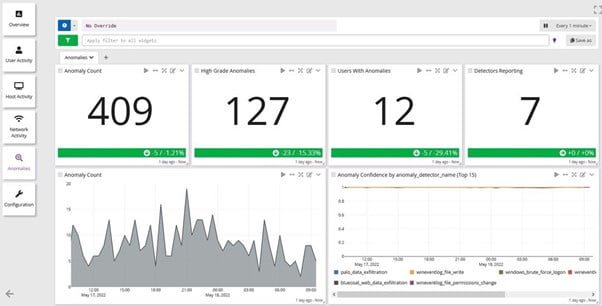
Isolate the Source of the Activity and Quickly Respond to the Threats
Capacity planning report is an instrumental source of data that is critical for future resource planning and budgeting purposes. With the capability to predict growth, it helps businesses avoid unplanned operational expenditure.
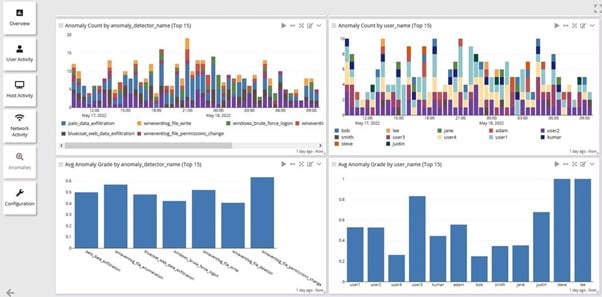
Log Management Done Right
Customizable Alerts & Notifications
Start fixing issues before they impact your customers.
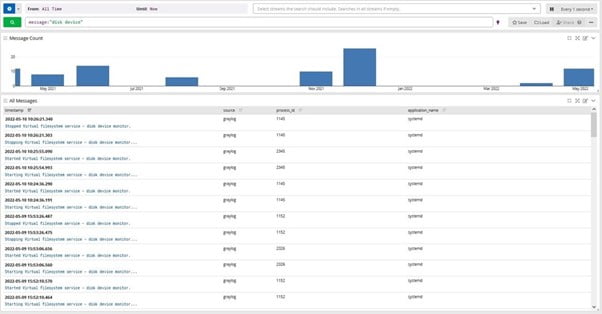
Powerful Search and Filter Capabilities
Parse terabytes of data in seconds for faster troubleshooting.
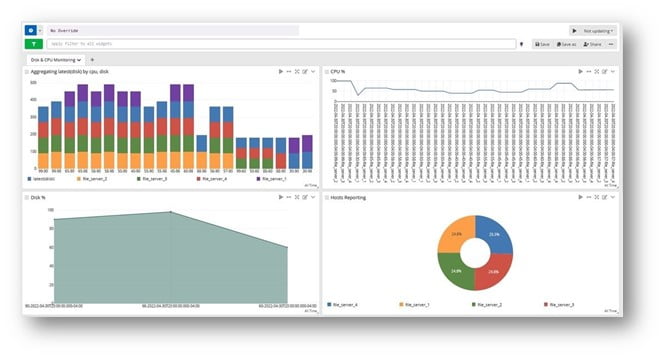
Event Log Collection & Analysis
Get to the root cause of performance issues and bottlenecks faster.
SIEM Done Right
Intuitive Cyber Incident & Anomaly Detection
Proactively detect, hunt, and investigate internal and external threats.
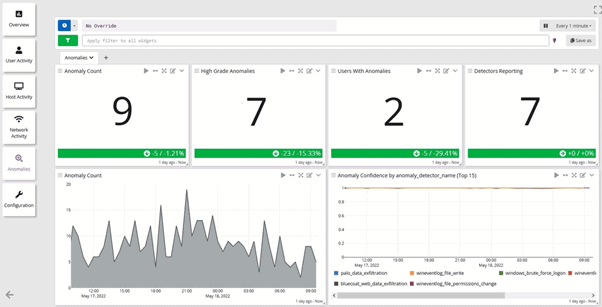
Enhanced Security Capabilities & Security and OPS Collaboration
Work as a team to keep your organization secure.
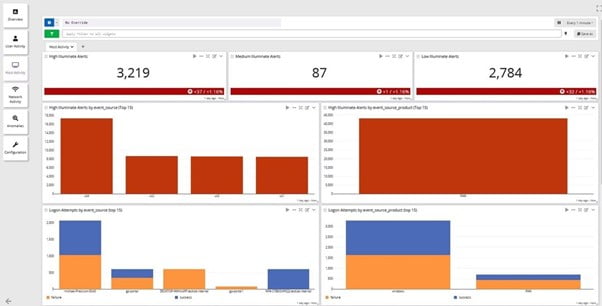
Be the first to know when potential problems need attention by automating alerts and notifications.
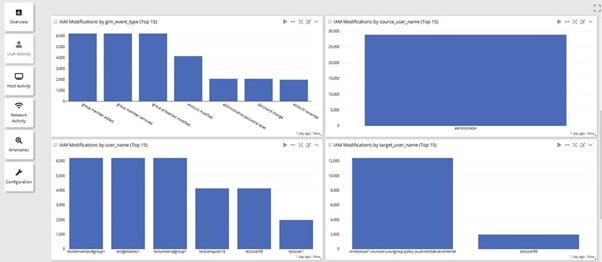
Simplified Audit & Compliance Reporting
Stay on top of ever-changing regulatory compliance obligations.
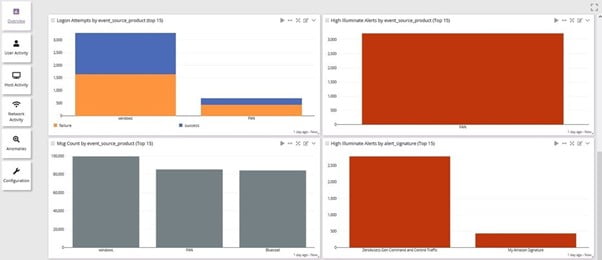
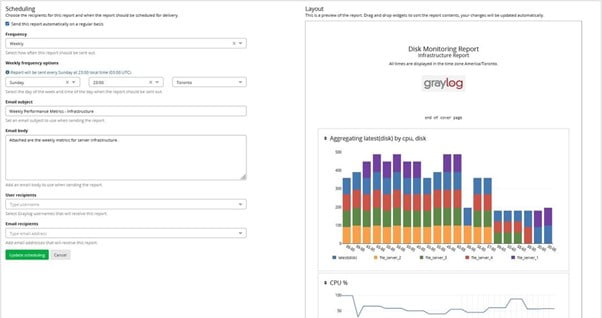
Reporting
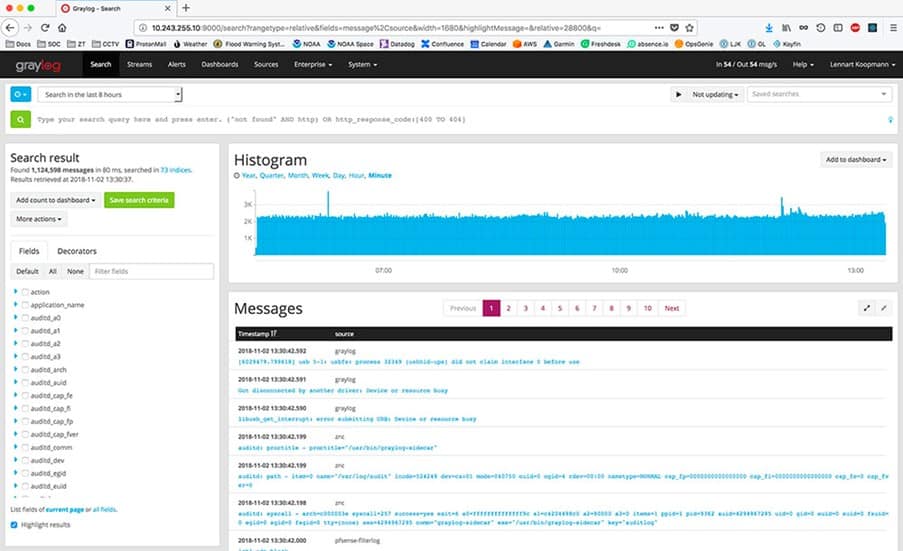
Reports are extremely easy to build and configure, leveraging the dashboard functionality to provide the scheduled reports you need. Because of this, you already have built-in chart types, relative time frames, and sophisticated target data rules.
Setting up a report takes just a few minutes: put in the title, add your logo if you want, set the schedule, pick which dashboard widgets you want included, customize the email, and your report is ready for distribution or viewing.
