Application Performance Monitoring and Metrices
Instana
Our Solutions
Network
Monitoring

Introduction
Organizations need to monitor application performance to keep applications running smoothly, prevent outages and help DevOps teams deliver better software faster. But in today’s application environment, that job has gotten more complicated.
Application performance monitoring (APM) tools were designed to help IT teams continuously track application performance so they can identify and troubleshoot issues, address problems and optimize resource usage. These tasks are pretty important since you need to know when your website or application is down, determine what went wrong quickly and prevent it from recurring in the future. APM tools promise to give organizations visibility into their application performance so that they can make sure their apps perform reliably.
In the last decade or so, application environments have become increasingly complex compared to what they once were. Change is constant, and modern application environments include cloud-native apps and services in distributed architectures with highly complex interdependencies. Monitoring a modern application stack consisting of so many disparate systems and tools is no easy job, but it remains more important than ever.

Benefits
APM tools are designed to provide visibility into your apps — to help you understand what’s going wrong and why, and to prevent future issues. To put it simply, APM tools can help you:

Keep your users happy.

Avoid wasting time and resources.

Empower your IT teams to work more efficiently.

Quickly isolate the root cause of an issue and move to resolution faster.

Understand the interrelationships in your application environment.

Gain actionable insights.

Launch applications faster than your competitors.
Features
Automate Full-Stack Visibility
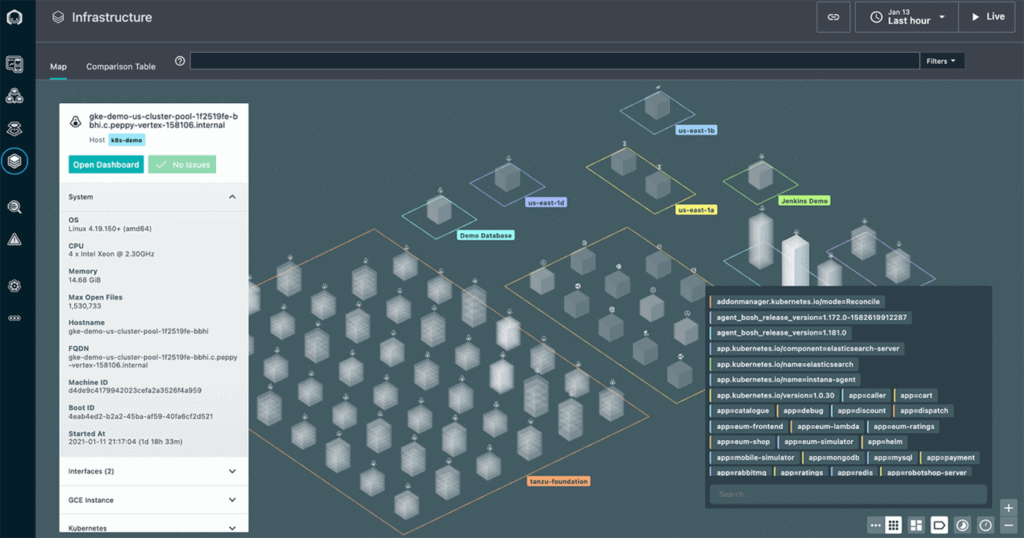
Single Agent per host auto & continuous discovery all components and deploy sensors crafted to monitor each technology. If you refer to instna.com the list of supported tech is VAST
Sensors automatically collect changes, metrics, and events. High fidelity with 1 second metric granularity and every request is traced automatically, no sampling or partial traces.
For each sensor, there is an out-of-the-box curated knowledge base of health signatures that are evaluated continuously against the incoming metrics and are used to raise issues or incidents depending on user impact. Component’s health is determined by applying machine learning and preset health rules. “Issues” are created for any unhealthy component, while incidents are only raised when end users are impacted
Automated full-stack application visibility – including real-time change detection, mapping, tracing and profiling – all with 1 second granularity and no trace sampling.
Accurate Data Context
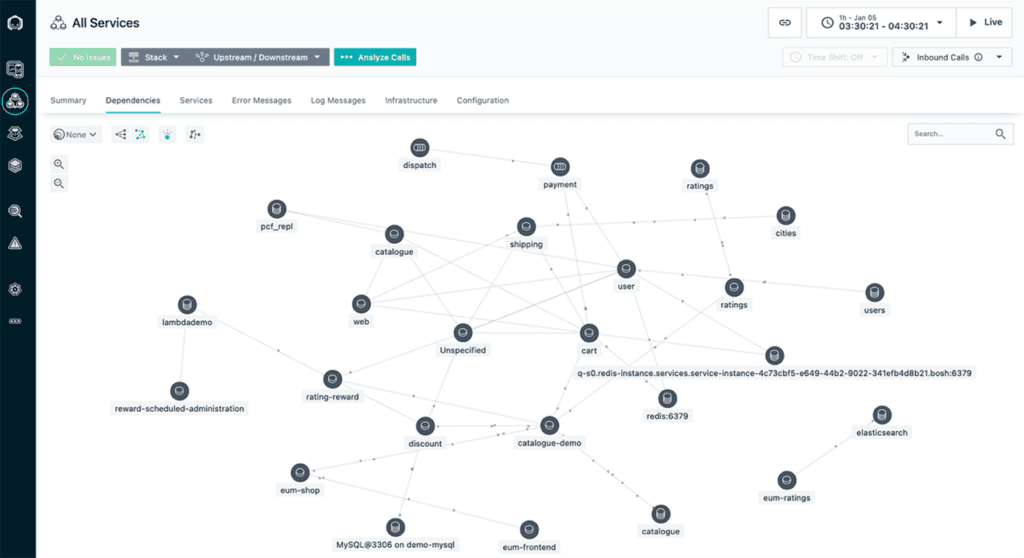
Records relationships between all entities in real-time, giving users knowledge of all inter-dependencies
(The dynamic graph is a model of your application that understands all the physical and logical dependencies of components such as Host, OS, JVM, Cassandra Node, MySQL, etc. The graph also includes logical components such as traces, applications, services, clusters, and tablespaces. Components and their dependencies are automatically discovered by our agent and sensors, which means that the graph is up to date in real-time. Every node in the graph is also continuously updated with state information like metrics, configuration data, and calculated health value based on semantical knowledge and a machine learning approach. This knowledge analyses the dependencies in the graph to find logical groupings, like services and applications, to understand impact on that level and derive criticality of issues. The whole graph is persistent, meaning the Instana application can go back and forth in time to leverage the entire knowledge base of the graph for many operational use cases.)
Analyze incoming data in real-time, uncovering anomalies and service issues to create ‘incidents’ nearly instantaneously. Every discovered component becomes a node in the Dynamic Graph that captures its state and includes metric data, configuration, dependencies, and component health.
logically define and view individual applications so you can quickly find the bottlenecks in the services you care about. Get the context you need by filtering out the noise, cutting millions of metrics to just the ones that impact your code, services, and applications.
Take Intelligent Action
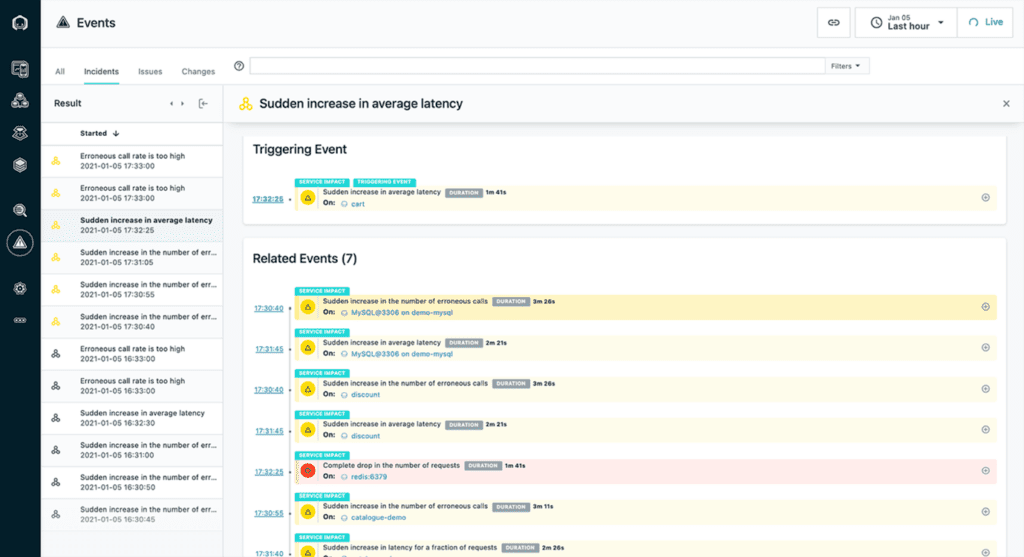
Instana automatically detects changes, issues, and incidents to help you detect and investigate the root cause of every service impact. An Incident is a ‘root cause report’ with a correlated sequence of Events and Issues identifying the exact source of the problem. Incidents include metrics, traces, exceptions, logged errors, and configuration data correlated via the Dynamic Graph to facilitate root cause analysis
Correlated applications, Kubernetes, and infrastructure stack as well as the dependent upstream and downstream services. Instana’s Context Guide acts as a GPS device, navigating you through the most complex issues. The Context Guide allows anyone to navigate through the Dynamic Graph so that every user, from Dev and DevOps to business executives, understands the impact of each and every service on other services, end-user experience, and overall service levels, so they can take the appropriate action in every situation.
Get immediate, automated feedback on every new release, deployment, and version with a full understanding of the impact and changes so you’ll immediately know if a change had a positive impact, or needs to be rolled back.
A Powerful analysis capability. Filter every aspect of data in unlimited combinations to discover performance outliers & problem patterns.
Analyze incoming data in real-time, uncovering anomalies and service issues to create ‘incidents’ nearly instantaneously. Every discovered component becomes a node in the Dynamic Graph that captures its state and includes metric data, configuration, dependencies, and component health.
Logically define and view individual applications so you can quickly find the bottlenecks in the services you care about. Get the context you need by filtering out the noise, cutting millions of metrics to just the ones that impact your code, services, and applications.
The Context Guide allows anyone to navigate through the Dynamic Graph so that every user, from Dev and DevOps to business executives, understands the impact of each and every service on other services, end-user experience, and overall service levels.
Unmatched comprehensive tracing support to consume and analyze every trace, regardless of how it’s captured. Integrates with major logging tools like Splunk, ELK, and Humio.
Find anomalies in metrics (to trigger), traverse the graph to discreetly find related events, order them by time and relevance to find root cause. it’s not always 100% but we are constantly making it better! (implies having explained the dynamic graph first or doing it with this conversation).
Monitoring Technologies
Automatic infrastructure and application monitoring with no plugins or application restarts
Over 250 monitoring technologies. Click here for the full list.
