Network Monitoring
NAGIOS XI
Our Solutions
Network
Monitoring


Introduction
Graylog Operations is built on the Graylog platform for IT, Network, and DevOps professionals. Available in a self-managed or cloud experience, Graylog Operations offers a powerful, flexible, and seamless centralized log management experience. You have increased visibility into day-to-day operations to gain meaningful context from volumes of event log data, pinpoint errors, take action faster, and improve key metrics like Mean Time To Detect (MTTD) and Mean Time To Respond (MTTR).
Benefits

Comprehensive IT
Infrastructure Monitoring

Visibility

Awareness

Proactive Planning

Customizability

Ease of Use

Multi-Tenant Capabilities

Extendable Architecture
Features

Powerful Web Interface

Performance and Capacity
Planning Graphs

Dashboards

Views

Web Configuration GUI

Configuration Wizards

Advanced
Configuration Manager

Advanced User
Management

User-Specific
Notification Preferences

Non-Stop Operations

Extendable Architecture

Database Backend
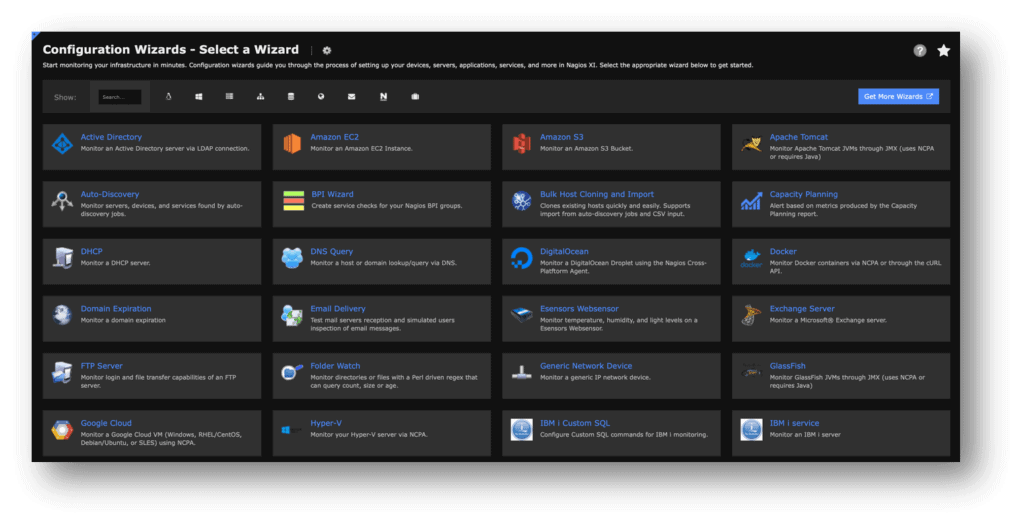
Configuration Wizard

Configuration wizard enables ITOM engineers to effortlessly add new host* and immediately start monitoring it. It has the capability to auto detect all possible services** to monitor in a host and makes it easy for an engineer to set threshold values and notification settings.
*A host is any equipment with an IP address, example: 1 Microsoft Exchange server is considered as 1 host or 2 firewalls are considered as 2 host.
**Services are those which are used by Nagios to check something about a host, example, CPU, memory, hard disk, etc.
Business Process Intelligence (BPI)

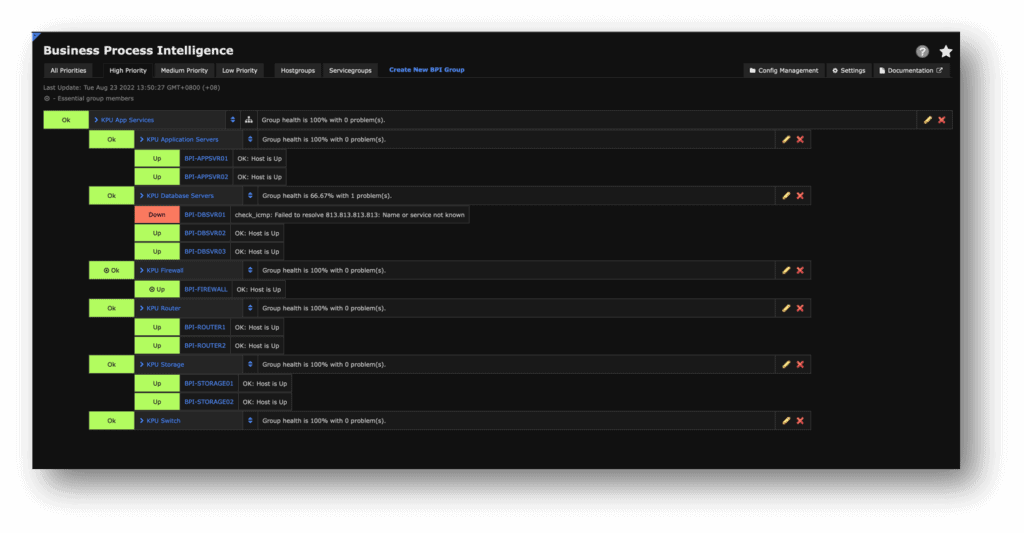
Nagios BPI was created as a way to visualize business process health by grouping hosts and services together, and creating rules to discern the true health of the network infrastructure as it relates to the business. An admin can define rules for each BPI group, and monitor the health of the group’s state based on what has been defined.
For this particular business process, a redundant database solution is being used for a app service. If one of the 3 database servers goes down, there are two more servers in place to act as fail-over solutions. Even though the first server is in a critical state, the actual business process of the app service is still in an OK state because all services required for it to run correctly are still in place.
However, if the firewall were to stop working for this process, the end user would not be able to utilize the web service. Therefore we call these services Essential Members for this business process, and if any of them failed, the business process would be in a critical state. In Nagios BPI, Essential Members are denoted with a target icon.
Reports
Get valuable information from the available reports. Everything has been well though in Nagios XI’s reporting.

Available list of reports:
- Availability
- Executive Summary
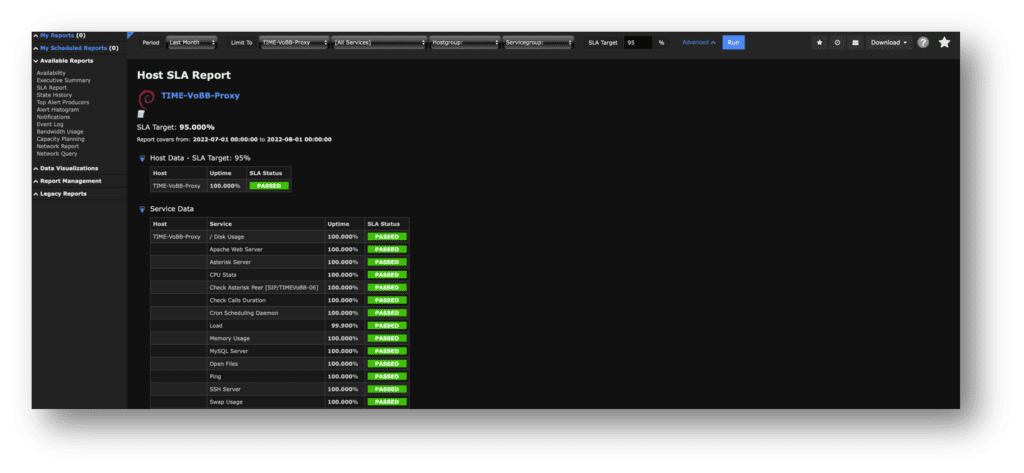
- SLA Report
- State Report
- Top Alert Producers
- Alert Histogram
- Notifications
- Event Log
- Bandwidth Usage
- Capacity Planning
Capacity Planning Report
Capacity planning report is an instrumental source of data that is critical for future resource planning and budgeting purposes. With the capability to predict growth, it helps businesses avoid unplanned operational expenditure.

Dashboards
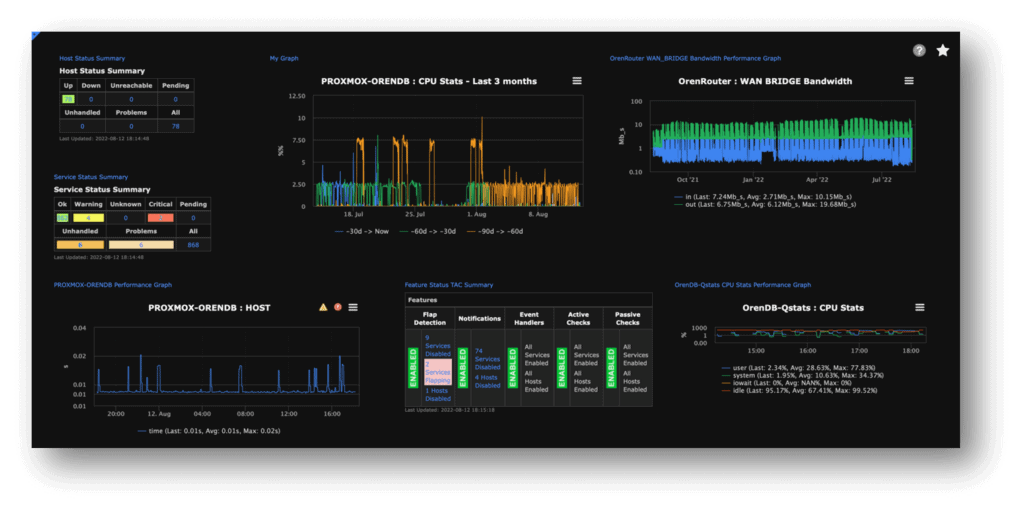
Personal dashboard gives the ability for the ITOM team to place relevant information that is vital for them to perform exceptionally well at work.

